Week 5: What Am I Building?
Welcome to Week 5! I’m putting this short post out there because it would be great to see how my education in Rust is contributing to a real-world problem and product.
Under Elliott Slaughter, I am working on tooling for the Legion project which is a HPC programming system written to be used on large-scale supercomputers. With a supercomputer comes the overhead of debugging a supercomputer, which is where a large effort in collecting and visualizing terabytes of logs comes into play.
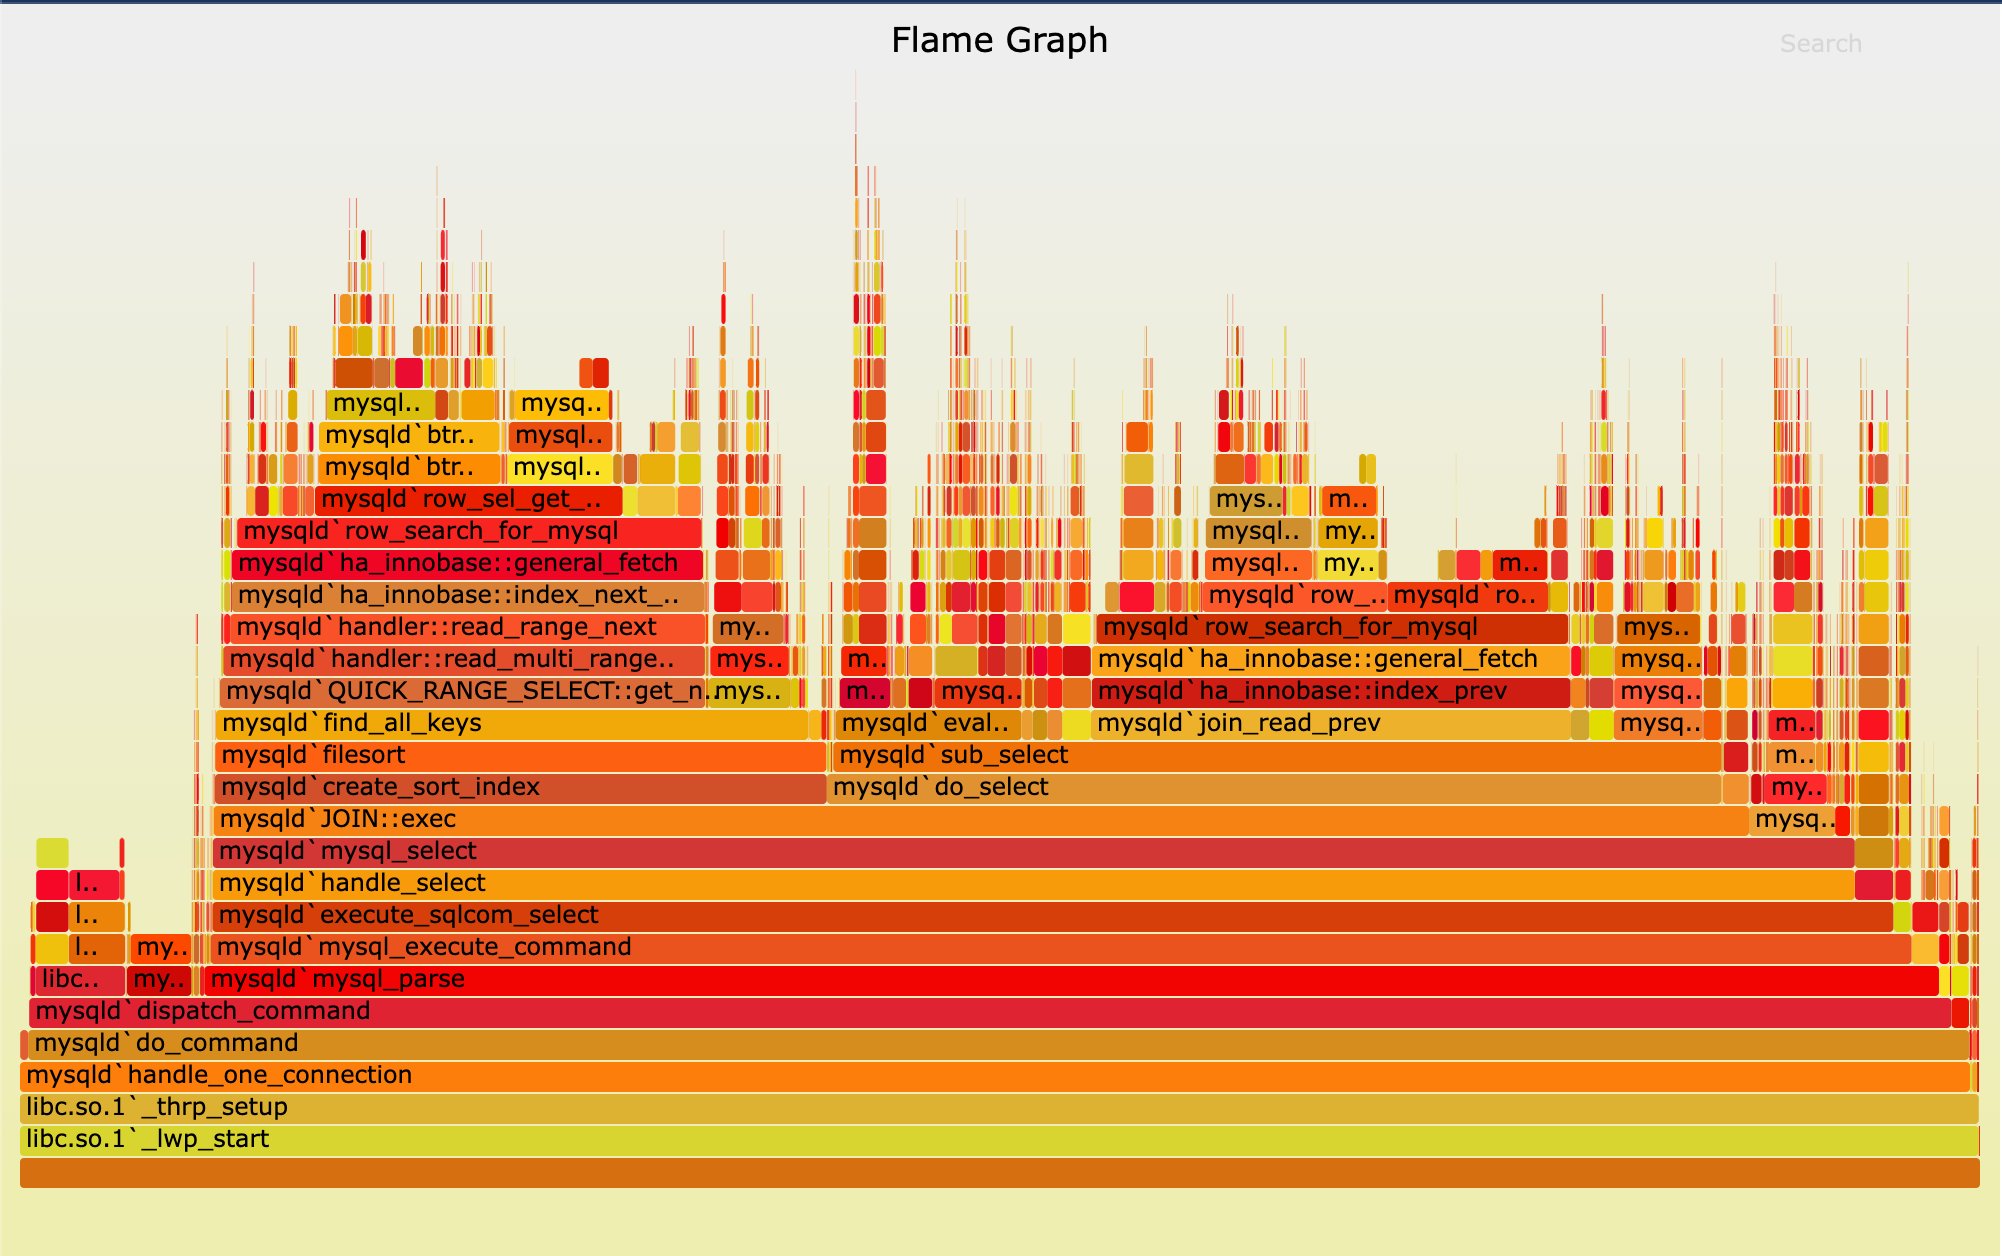
“Terabytes?” you ask. 100% I say, as you must consider the massive amount of scale a cluster can run at. Even if a single GPU produced 1MB of metadata/logs over the course of an hour, if you scale to 10000 GPU’s, you now have produced 10GB. You can also factor in that the GPU is not the only device running on a cluster, you also will have the CPU running tasks, memory channels being constantly rewritten to and flushed, framebuffers driving computational display output, etc. To throw an even larger wrench into the works, imagine a job running for a whole week instead of a whole hour. This create a multi-dimensional visualization task for the engineers that need to inspect, understand, and optimize the performance of such behemoth clusters. That’s where prof-viewer comes in. Originally a javascript based visualization tool, prof-viewer emulated the likes of a multi-device flame graph
Flame graphs are a way of visualizing dependent tasks on a timescale for the purpose of identifying bottlenecks, loops, and other code anomalies that may be unintended or ill-performing. The goal of prof-viewer is to give an engineer a large magnifying glass to be able to zoom in on the state of a cluster running a job and inspect exactly how tasks behave across different machines.
Here’s a sample view of what prof-viewer looks like.
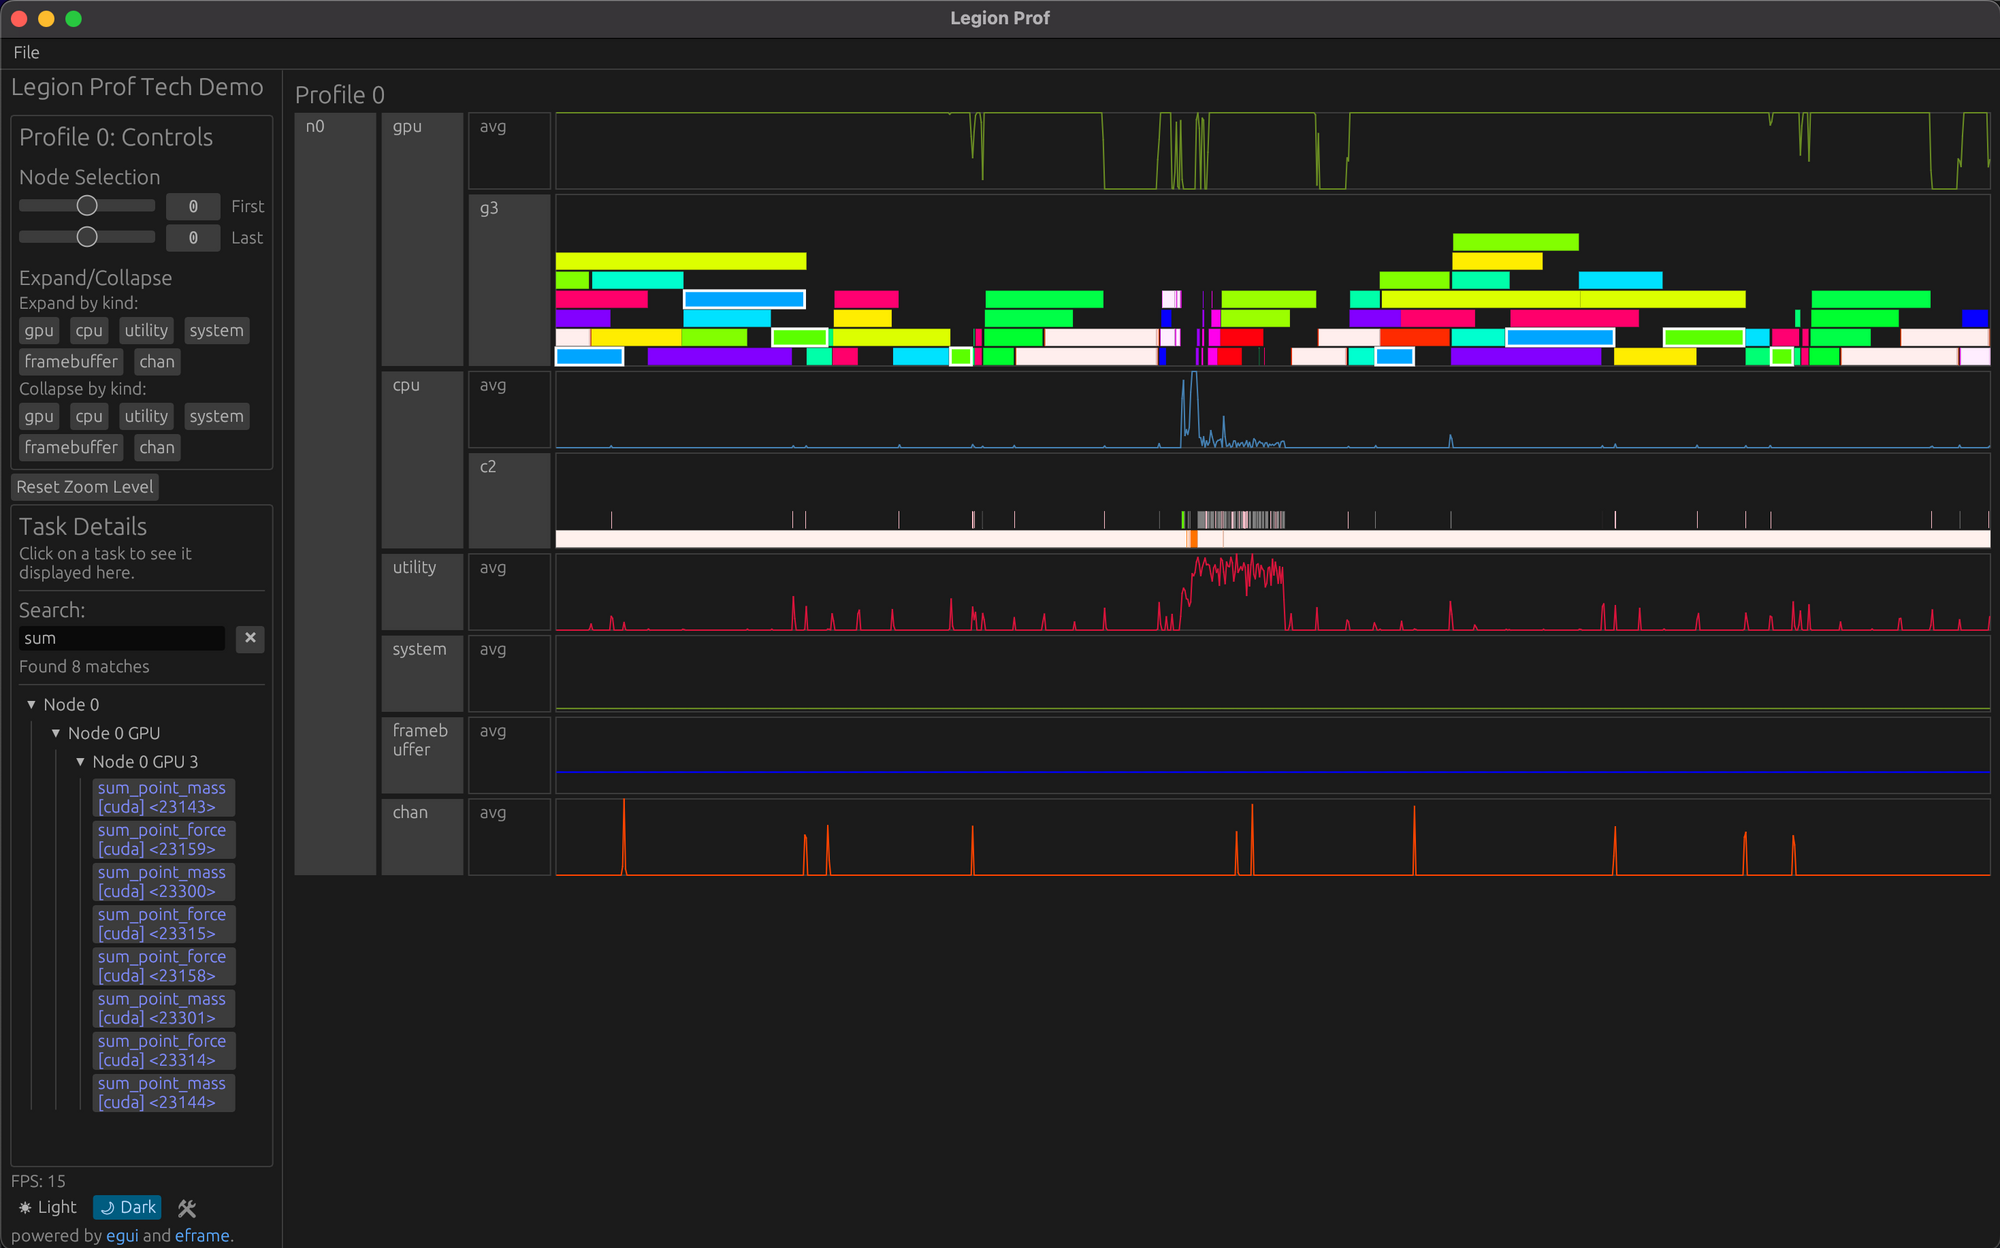
An engineer is able to get rich metadata on each task running with a tooltip hover, but are also able to stay zoomed out when understanding a jobs runtime.
The system is entirely built from Rust from the backend that takes raw log output and produces a proprietary format for displaying logs to the graphical user interface (which I will discuss next week, in Week 6). A primary feature that I worked on was developing a search feature that would allow the ability to quick find tasks pertaining to a certain keyword, and highlight them in the viewer. Since there can be a lot of data on the screen at once, it is important to have an accordion-style expansion of panels to hide the massive amount of 2D space tasks can take up. Regardless, a search should be able to query outside the bounds of your eye sight to give you clues towards a related task you are thinking about. The sidebar gives you a quick way to jump through the large hierarchy of nodes and devices that a task could be under.
It was really exciting to dive into a relatively verbose codebase that allowed for hands-dirty access to the UI and data structures that represent both the logs and the interface. Even though the features may be simple and intuitive to an end user, there was plenty of thought that went into the design of the data structures and querying/layout of the tasks to increase performance and reduce load on the backend.